Teaching Intermediate R
What is Intermediate R?
Is it this?
… or this?
… or this?
result <- data_main %>%
  left_join(meta_info, by = "id") %>%
  pivot_longer(cols = starts_with("score_"), names_to = "metric", values_to = "score") %>%
  filter(!is.na(score)) %>%
  group_by(group, metric) %>%
  summarize(mean_score = mean(score), .groups = "drop") %>%
  pivot_wider(names_from = metric, values_from = mean_score) %>%
  inner_join(group_labels, by = "group") %>%
  arrange(desc(overall))
Our answer: YES!
Who are we?
 Allison Theobold
 Charlotte Mann
 Emily Robinson
 Zoe Rehnberg
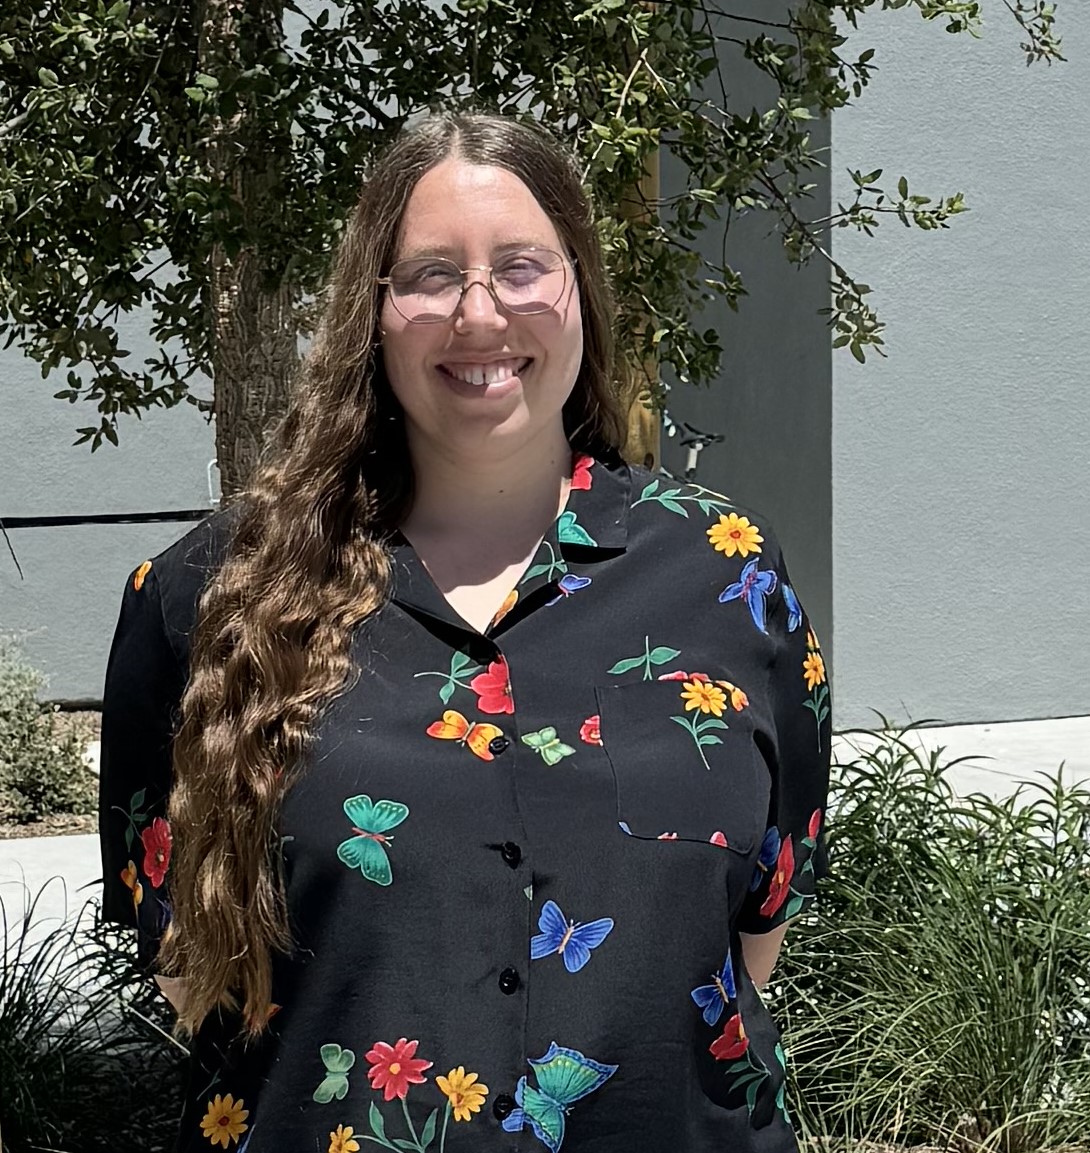 Julia Schedler
 Tyson Barrett
Funding from the Noyce School of Computing at Cal Poly.
What is Intro R?
Plenty of resources…
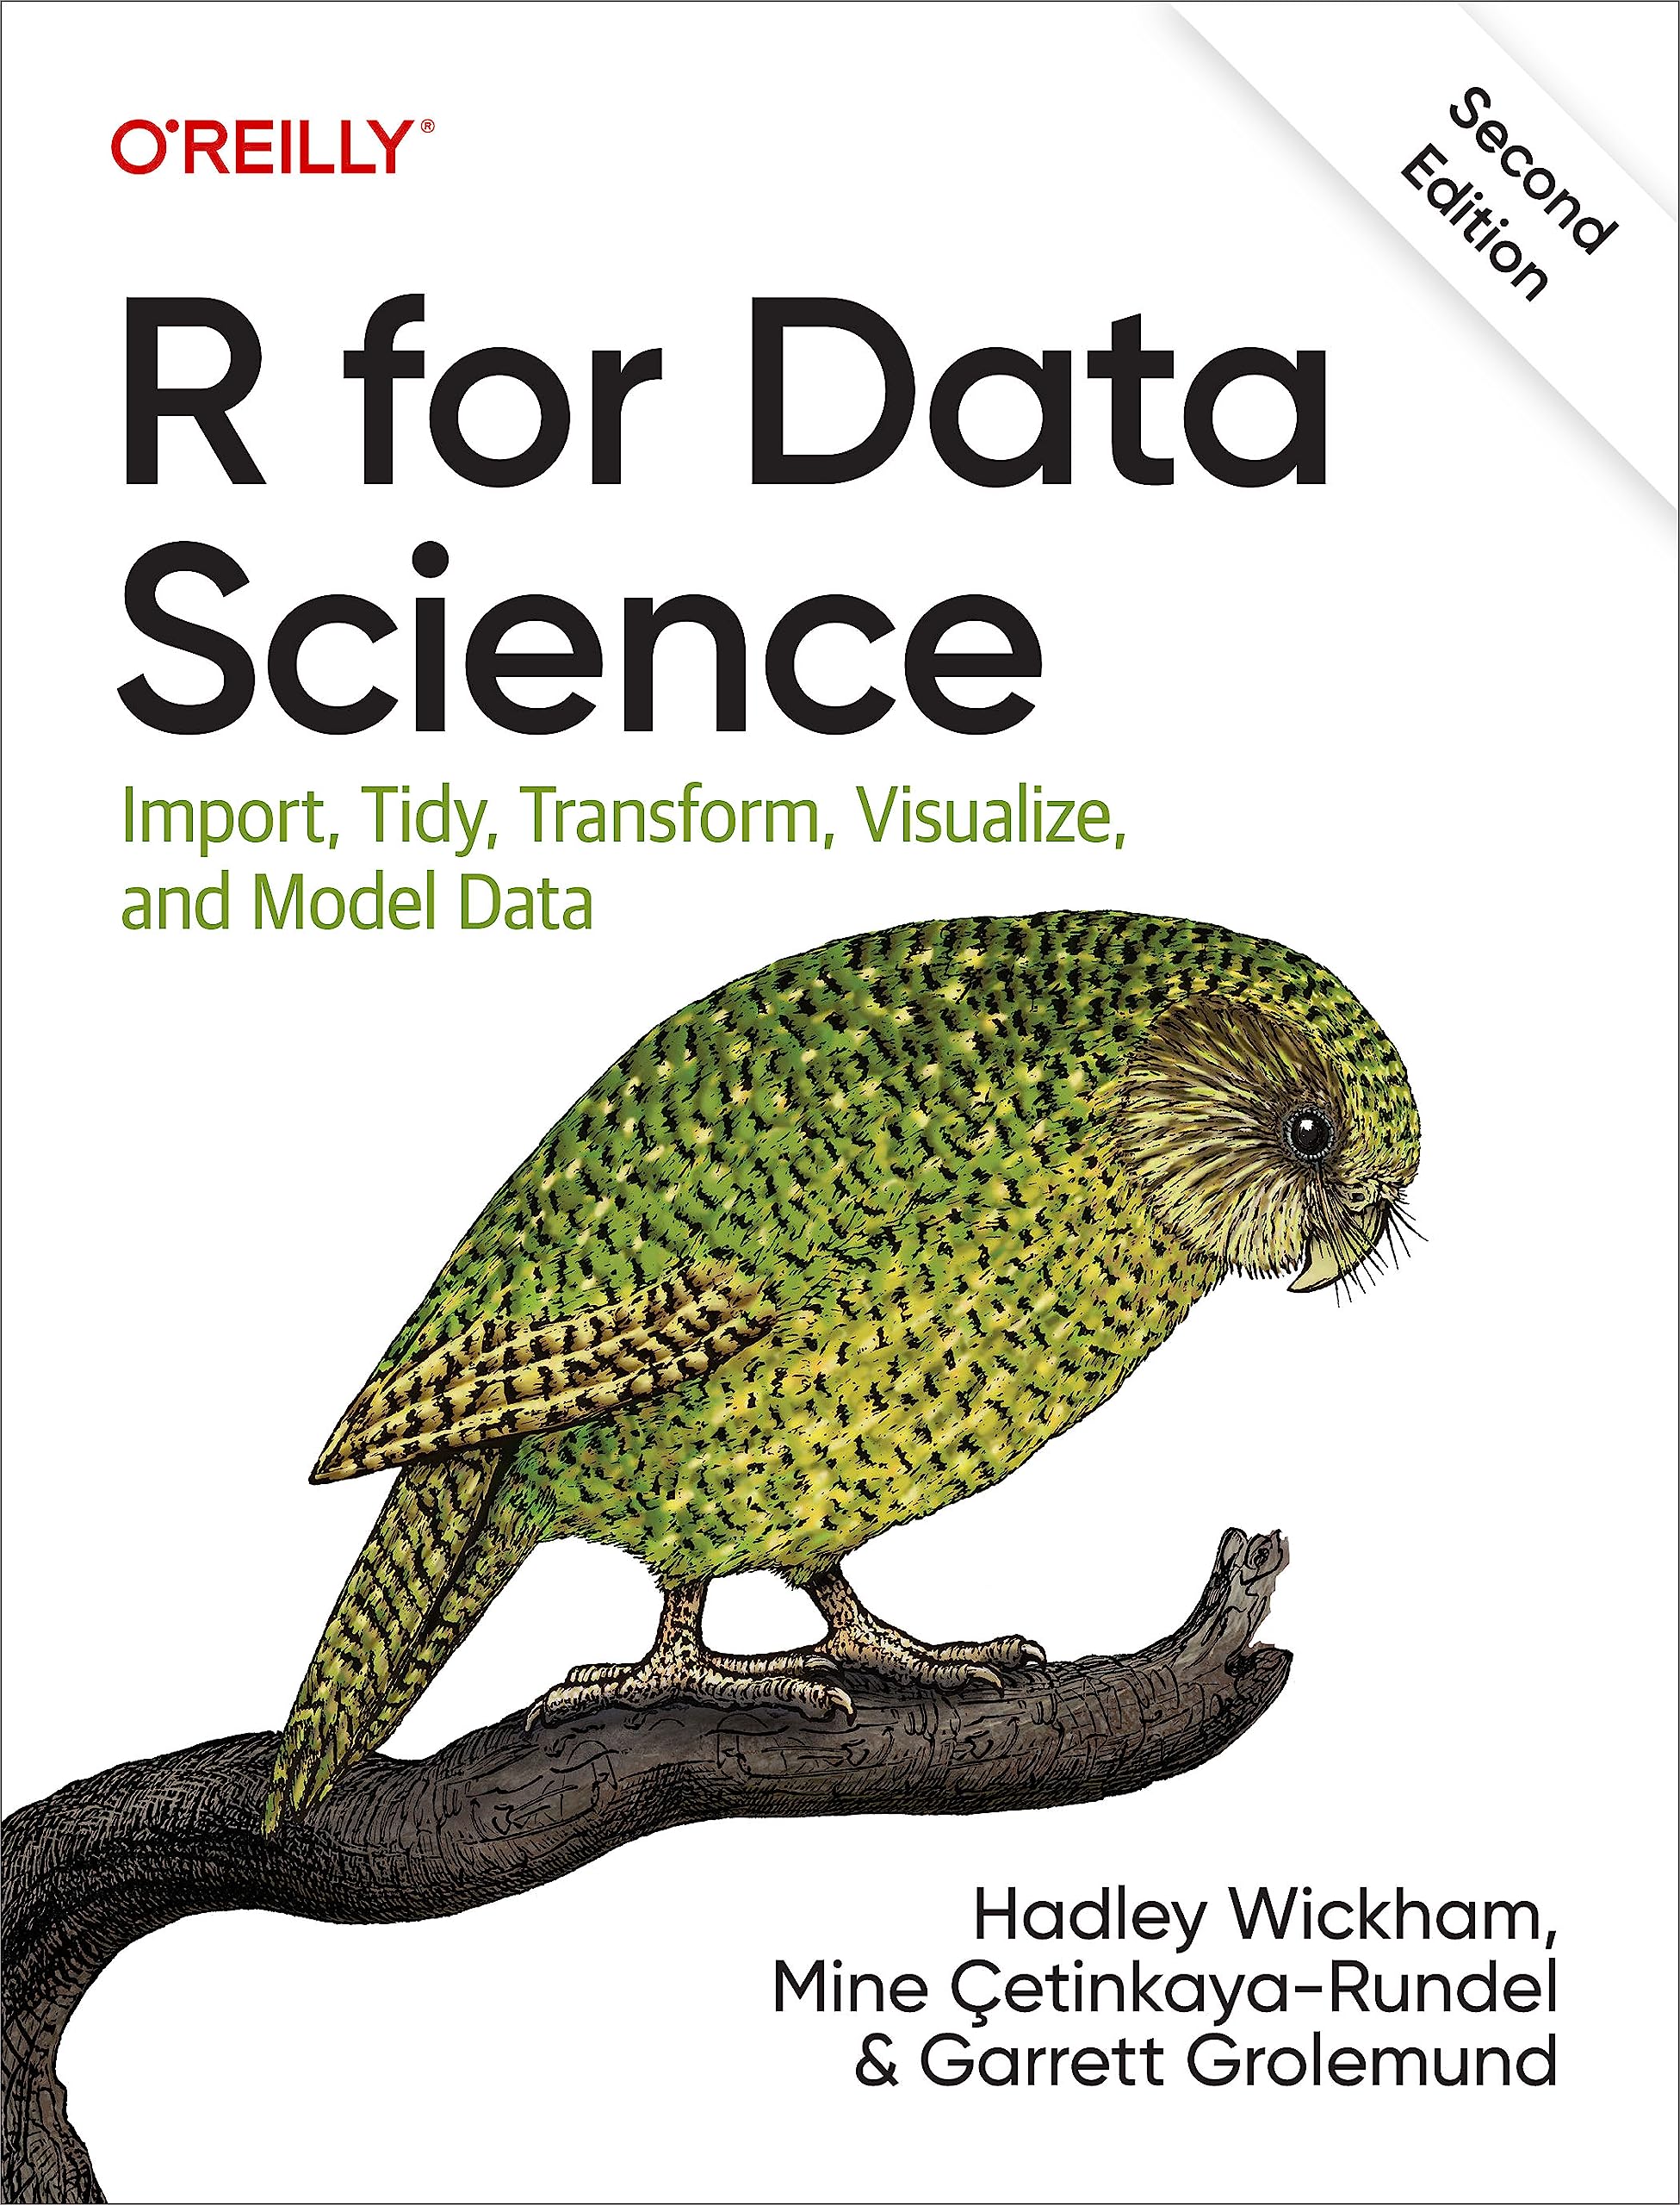
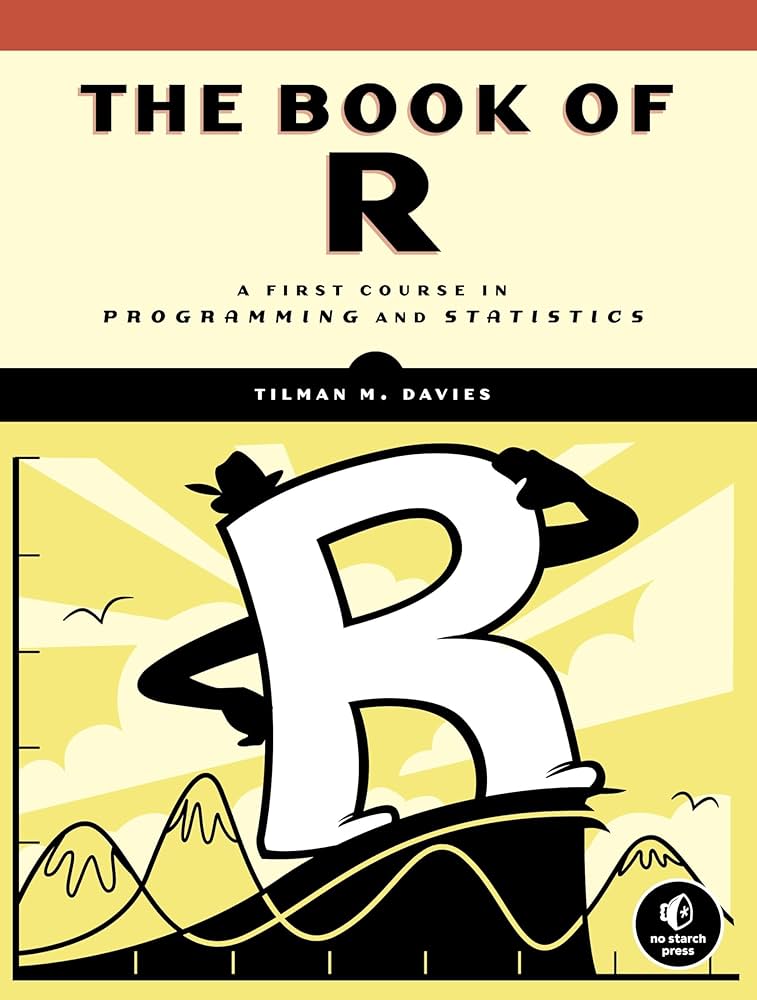
… and generally agreed-upon topics.
Basics of coding: variables and objects; loops and conditionals; etc.
Installing and loading packages
Object types and structures
Loading and examining data
Basic visualization
Data wrangling (“Big 5” tidyverse verbs, or equivalent)
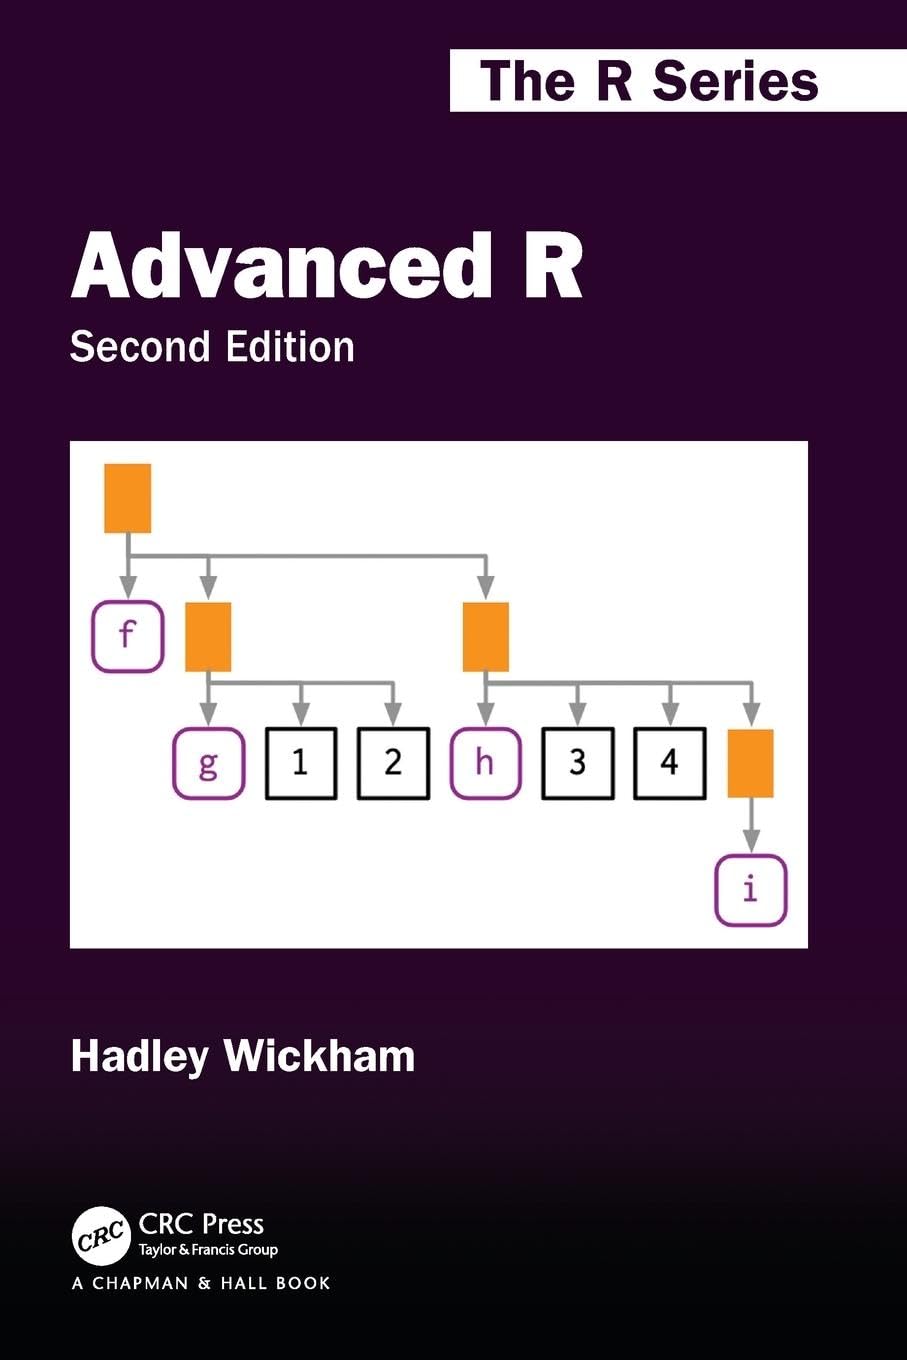
What is Advanced R?
Is it just programming? Of course not!
What is Intermediate R?
Intermediate R is NOT Intermediate Statistics
The hardest part of fitting statistical models in R is the statistical concepts and interpretation not the coding.
“[Statistical Topic] with R” is not the same class!
Our course focuses on R Skills and requires only second-year statistics knowledge.
Intermediate R is non-linear
It is not a bridge between Intro R and Advanced R
It is not a set of skills that builds progressively
It is a collection of learning paths (sometimes overlapping) towards a specific end goal.
Our course has three units that can be rearranged modularly
Intermediate R is defined by goals
Different R learners have wildly different needs.
There is no single skill that every Intermediate R user must know!
Instead, identify a use case and goal that is not achievable with Intro R skills, and fill in the missing skills.
Our course is project-driven, not exam or assignment based.
The structure:
Three Modular Units
 Data Science
 Programming
 Deliverables
Unit A: Intermediate R for Data Science

Unit A: Intermediate R for Data Science
Learning Objectives
Manage, process, and load data from non-tabular and non-local sources.
Clean and prepare messy and unstructured data, including handling missing values, and the use of regular expressions to extract information from text data.
Use joins to combine multiple datasets with many-to-many relationships.
Use complex data wrangling pipelines, including multiple pivots and/or multiple grouping levels, to wrangle data.
Produce visualizations beyond basic geometries, including maps and annotated plots.
Unit A Project
Students will produce a stylized, publication-ready report that performs exploratory data analysis to address specific research questions.
Data for the report will be taken from multiple online and non-csv sources, and will require the use of regular expressions to collect, clean, or wrangle their data.
Research questions will be provided that require complex, multi-step data wrangling, and results should be communicated using complex and polished visualizations.
Unit A Project - Example
Regional Differences in Fast Food Preference
Data: Refer to this dataset of fast food locations across the US. Then, use Yelp’s open dataset for education to find reviews and other information pertaining to fast food restaurants.
Unit A Project - Example
Regional Differences in Fast Food Preference
Research Questions:
Are certain fast food brands more prevalent in different regions of the US than others?
Are certain fast food chains more highly rated in different regions of the US than others?
Do reviewers use different language in their reviews in different regions?
Do customers have different priorities for what they look for in fast food restaurants in different regions?
Unit A skills and resources
Non-tabular and non-local data
jsonliteandXMLpackages for hierarchical data structures.odbc,DBI, anddbplyrfor cloud database-stored dataduckdbandarrowfor local database storage.data.tablefor large in-memory data
Messy and unstructured data
naniarfor dealing with missing valuesstringrand regular expressions for processing text variablesBasic content from Text Mining in R and the
tidytextpackageData cleaning principles from Reproducible Analysis with R.
Multiple datasets joining
*_join()functions fromdplyrConcepts of mutating joins and filtering joins (R4DS Chapter 19)
dbplyrand/orarrowto perform joins at database level
Complex data wrangling pipelines
Creation and matching of keys in relational data
Pivoting with
pivot_*()functions fromtidyr(content needed!)group_by()tomutate()pipeline constructionsUse of vectorized functions or
map/applyinsidemutate()Iteration with
purrrorapplyfunctions.
More advanced visualizations
geom_text()andgeom_annotate()for annotationsNew plot types from ggplot helpers - e.g. ridgelines from
ggridges; alluvial plots withggsankey, radar plots withfmsbandggradar.Chloropleths with
leafletandsf.Great resource: R Graph Gallery
Unit B: R Programming

Learning Goals
Apply function creation and code design techniques
Engage in algorithmic thinking, including iteration.
Consider speed and efficiency concerns in code tasks.
Develop a reproducible workflow for code development in R.
Engage in unit testing and code review, including of others’ code.
Unit B Project
Students will create a working and installable R package that is well-documented and tracked via version control. The package must include a demonstration document (or “vignette”) and several basic informal unit tests.
The package should provide well-designed and user-friendly functions to streamline a data collection, wrangling, and/or analysis task.
Code design should consider issues of efficiency and should demonstrate both tidyverse and non-tidyverse syntax fluency.
Unit B Project - Example
Creating your own webscraping API
Create an R package that provides functions to scrape, clean, and wrangle data from the McDonald’s menu. Then, provide a vignette document demonstrating use of this package. This package must be hosted on GitHub in proper installable format.
Unit B Project - Example
Creating your own webscraping API
Your code and/or vignette must:
Include at least one use of iteration with
purrrInclude use of
data.tablecode for large data preparation tasks.Be well-commented and code reviewed by peers.
Unit B skills and resources
Function creation and code design
R Packages textbook, first section. (Wickham and Bryan)
Code Smells and Feels talk by Jenny Bryan
Algorithmic thinking and iteration
CS 101 resources for algorithms (content needed!)
Create methods from scratch: basic linear regression, kmeans clustering, generative art, bootstrapping or randomization tests.
Speed and efficiency
Use
tictocfor informal speed testing;proc.time()for more specific speed testing; orprofileRfor full profiling.data.tablefor many groupings and concise syntax (content coming soon!)
Reproducible workflow
Happy Git with R textbook
Teacher resource: GitHub Classroom for providing skeleton code and controlling student repos.
testthatfor creating formal unit tests.roxygen2for function documentation
Unit testing and code review
Functional programming and unit testing for data munging with R online textbook
Computer science resources for code review principles (content needed!)
Code testing and review content from the Data Carpentries.
A few stretch goals
Package passes CRAN checks.
Use of object-oriented programming
Advanced debugging, e.g. with
debugonce()orbrowser()
Unit C: Extensions and Deliverables in R

Learning Goals
Incorporate interactivity into data reports.
Adopt extensions from peripheral software and packages, such as
quarto.Add statistical elements to data analysis pipeline.
Produce production-quality plots and tables.
Unit C Project
Students will create an interactive dashboard that integrates advanced R features, such as Shiny, Quarto dashboards, or Plotly, to explore and communicate a research question effectively.
The dashboard will include statistical results that are well-summarize, well-visualized, and well-interpreted.
Unit C Project - Example
Fast Food Preferences at McDonald’s
Using your Yelp analyses from Unit A and your menu analyses from Unit B, create a dashboard to understand trends and preferences for McDonald’s customers. The dashboard must be deployed for online access.
Unit C Project - Example
Fast Food Preferences at McDonald’s
Your dashboard must be interactive and accessible to non-technical audiences. It should communicate trends in regions as well as connecting Yelp review language to specific menu items.
You must include an element of results of a statistical model or test, communicated to non-technical audiences.
Unit C skills and resources
Interactivity
plotly()for immediately interactive plotsShinyfor user inputMastering Shiny textbook
Extensions and peripheral software

Quarto: Dashboards, themes, websites, etc. etc.reactjsfor animated visualization“Branding” use of css/scss.
Statistical elements
tidymodelsfor predictive modelingtidyclustfor unsupervised learningBootstrapping or resampling results
Production-quality plots and tables
Annotating plots with
geom_text()etc.gt()for better tables
Modularity
Order of Units
B -> A: Begin with webscraping, then incorporate other data and use it for analysis.
C -> A: Design a dashboard with simple, Intro R level analyses; then enhance the dashboard with more complex data.
C -> B: Create webscraping or data anaysis package, then use it underlying a dashboard.
Overlap in content
data.tablecan be emphasized in A for wrangling tasks, or in B as an efficiency/syntax skill.plotlycan be used in A for easy plot upgrade, or in C for interactive dashboardsGit and GitHub can be introduced in any Unit.
function writing can be used to streamline steps in units A or C before
Takeaways
Design your Intermediate R class around projects
Separate content into modular units organized by goals.
Sign up to be notified when the Course in a Box is available!

Thank you!
Thanks to:
- My awesome collaborators
- Noyce School of Computing
- NSF POST Grant #1005559
- Everyone who shares their great R materials online!